Google Analytics for beginners: the complete guide.


Google analytics for beginners: the complete guide, is a helpful resource we created to help you measure your marketing. Let’s start at the very beginning: Google Analytics is a service offered by Google that tracks and reports website traffic, it offers a great insight into the performance of your search engine optimisation (SEO) or Google Ads, but it can be hard to understand and see how you’re achieving your ROI.
So, now you know what Google Analytics actually is, let’s get down to business and share the best ways you can use it. Purpose Media’s Head of PPC, Matt Cocking, is here to help. He’s broken down the 5 most important metrics (and useful elements) and how to view them – so you can get the most from your data!

HEAD OF PAID MEDIA, MATT COCKING
Historically, I’ve written content where I delve deeper into Google Ads and Google Analytics. I offer advice on “the tough stuff” like how to structure your Google Ads account and how to use broad keywords more effectively. But to understand how these things can help you grow your business, I need to show you how to quantify the results of your efforts. This is the Google Analytics For Beginners guide I wish I had when I started out!
I think you’ve all been there. Your digital agency rocks up for yet another weekly, bi-weekly or monthly meeting. They come equipped with a 47-page slideshow full of numbers, all of which are “positive” metrics. They let you know that:
A. Your bounce rate was down 2% over the previous month.
B. People spent an average of 10 seconds longer on your website.
C. There was an average of an extra 0.23 pages viewed, per visitor.
The list goes on… we could, realistically, discuss these metrics for hours. We could delve into the paths that the customers took from page to page, and where they finally dropped off the site. We could analyse the demographic of the audience.
When you sat down to plan your year, was your goal for 2020 “to reduce bounce rate by 2% YoY”? – I’d imagine I know the answer.
So, with the above in mind, here are THE 5 MOST IMPORTANT metrics in Google Analytics that ALL businesses should understand and KPI themselves against.
I’ll admit, I’ve not started this “top 5 metrics” post very well, since number 5 isn’t a metric – but damn is it important!
The source/medium report is, in my opinion, the best place to get an overview of all of the traffic to your website and where it came from. The “source” generally being the website and the “medium” is the type of traffic e.g. paid (cpc), organic etc.
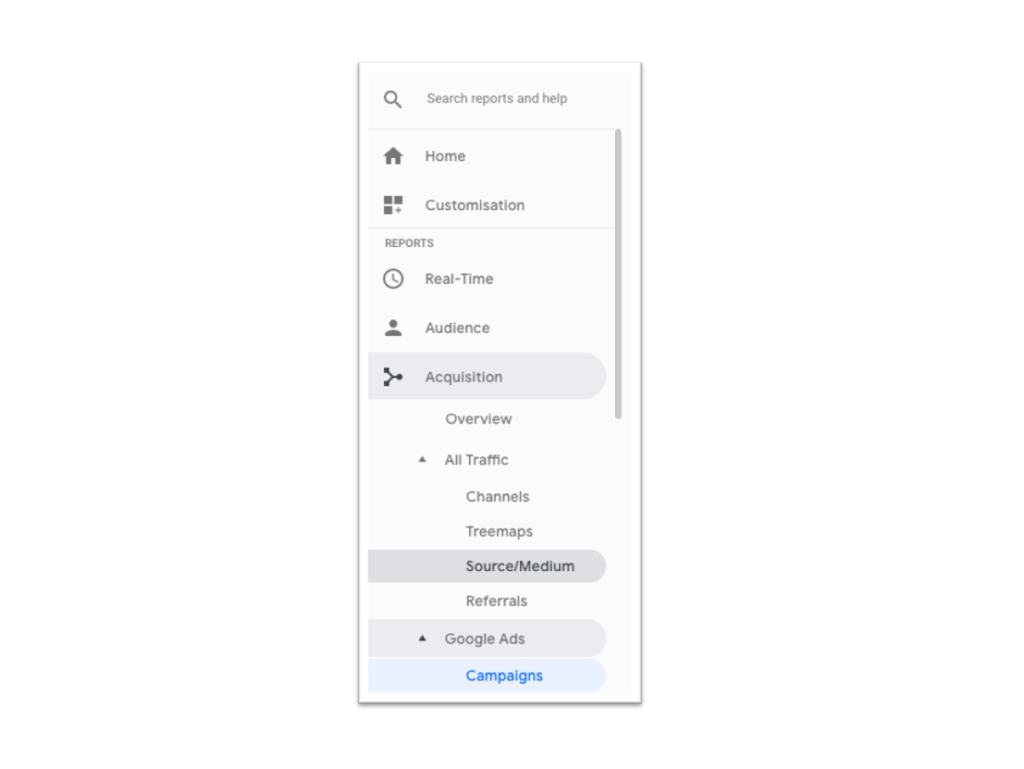
To find the source/medium report:
In the left side panel within Google Analytics, click Acquisition > All Traffic > Source/Medium.
Make sure to set your date range to encompass the data that you’d like to view.
How do you utilise this report to your advantage?
Well, it’s pretty simple. In the screenshot below you’ll see a list of different “source/medium” results. To give you an example “google / cpc” and “bing / cpc” are your paid traffic sources from Google & Bing. “google / organic” and “bing / organic” are your organic (non-ad Google search) traffic sources.
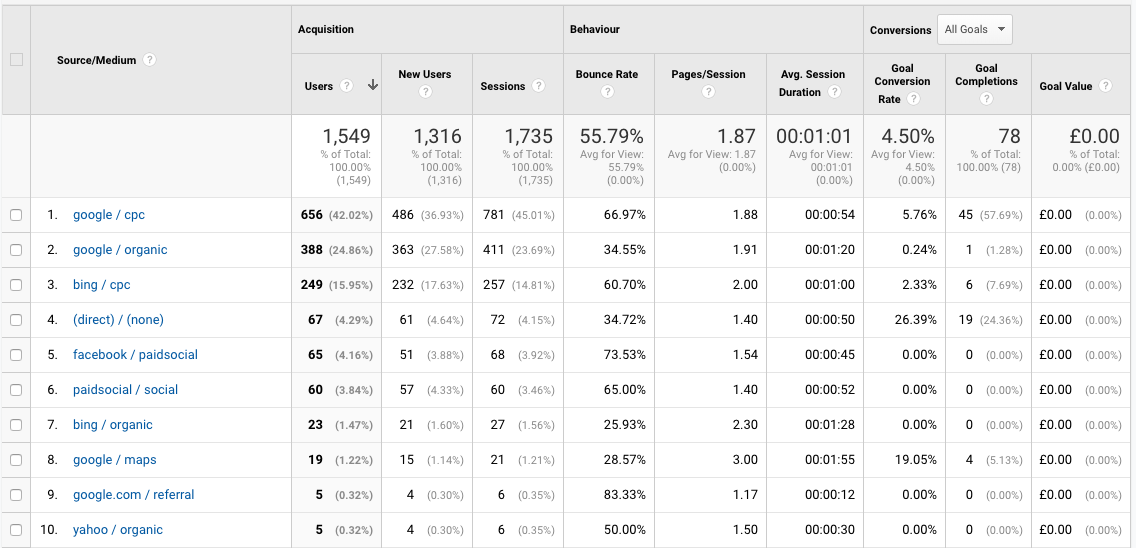
Why is this important? From here you can get a fantastic overview of where your traffic comes from specifically, as well as the number of goal completions, the conversion rate, the revenue etc. that is associated to each of the source/mediums. Essentially it can show you where your best performing traffic is, and which channels need some focused improvement.
Number 4 in our Google Analytics For Beginners guide leads us the slightly different, more mysterious, lands (pun completely intended). Now we know how to discover where our users arrive from source/medium wise, knowing literally where they come from is also exceptionally useful.
Imagine you own a chain of restaurants (or maybe, just maybe, you do! In which case get in touch today). You are running Google Ads for all of your restaurant chains to acquire new customers. You believe that you’ve set your ads up in a manner that will only target people who are searching in a particular area of the country, but in reality don’t feel as though it’s working correctly and that money is being wasted.
Roll in the location report:
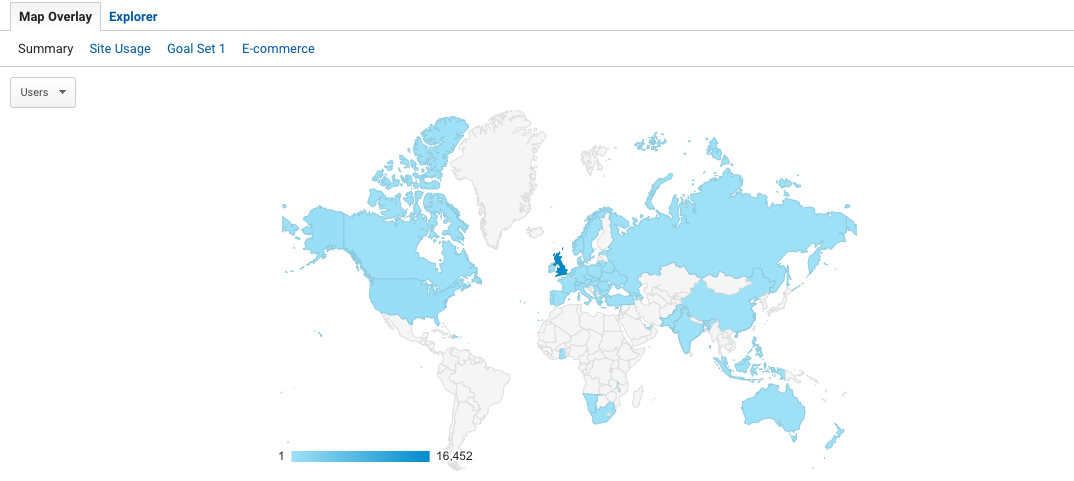
This report allows you to see specifically where in the world our users are and determine if we’ve set up our location targeting correctly in Google Ads. The report below helps us go into a little more detail, showing the country:
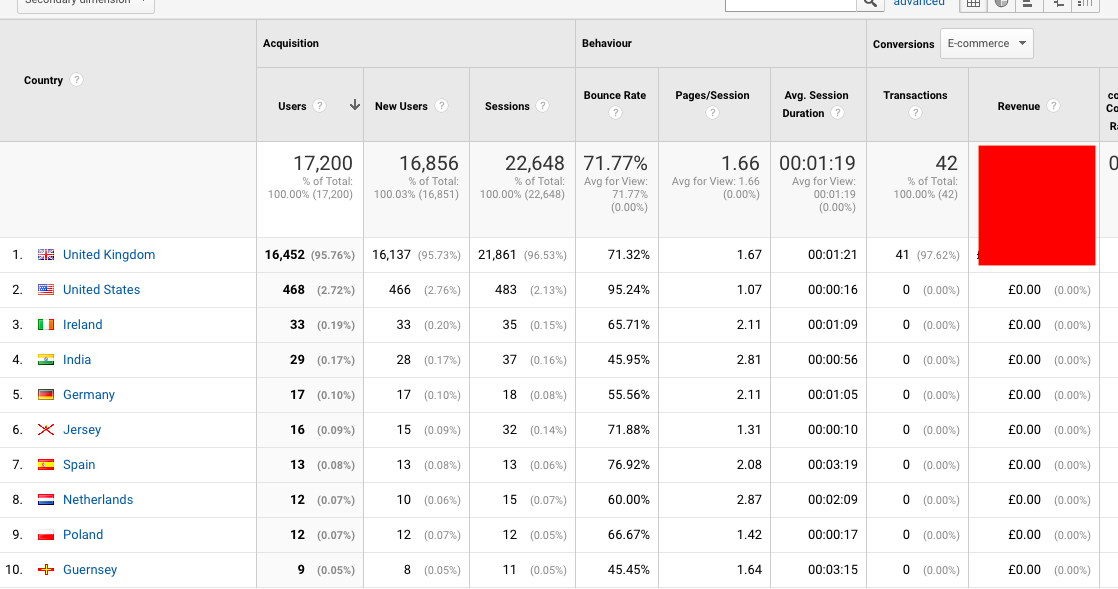
and we’re also able to select a view that offers us a more granular report per city:
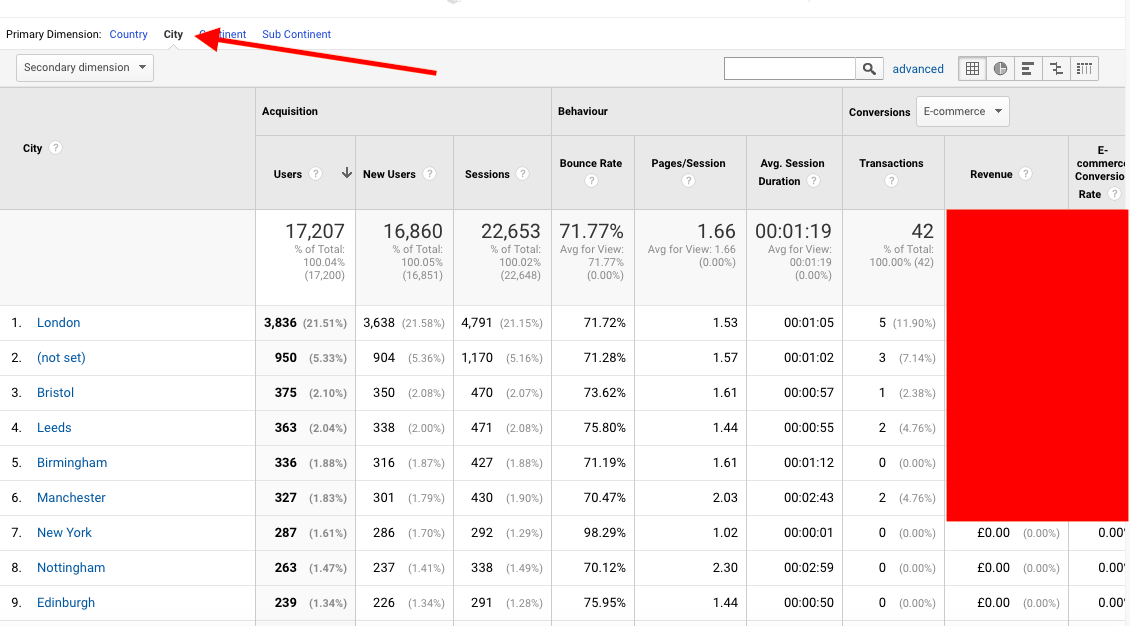
If, in this instance, you have restaurants in London, Bristol, Leeds, Birmingham etc. Then congratulations, you’re on the money! If not, you might need to re-visit this one.
To find this report, in the left-hand panel of Google Analytics click Audience > Geo > Location.
For number 3 we have the value/revenue per user. This is, as it says on the tin, the amount of revenue generated per individual user.
In this instance, I’m going to tell you how I feel that this information can be most effectively used to help you maximise your ads/website effectiveness.
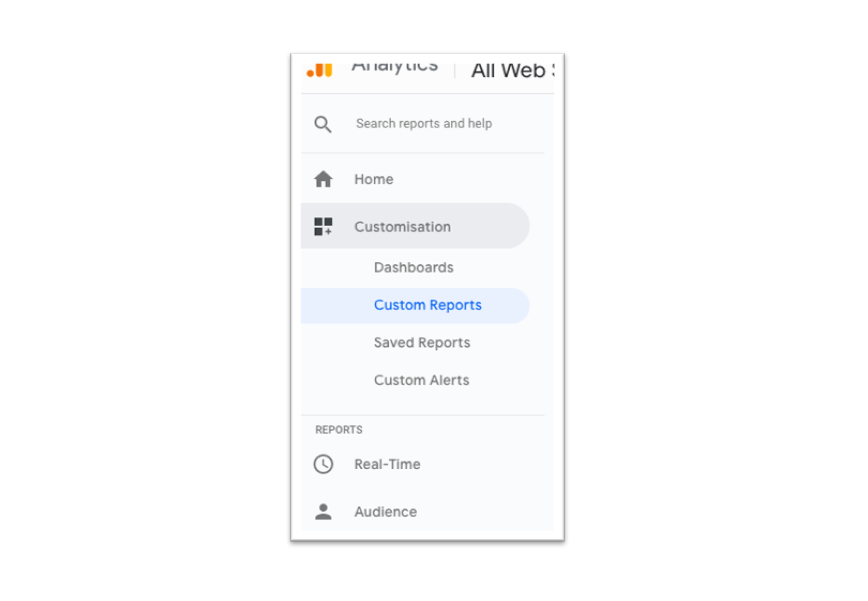
First of all, I’d pop to Customisation > Custom Reports as below:
Within this section, click “new custom report”.
We’re going to create a report giving details of the performance of our website, based on the average revenue per user, at the different hours of the day and on the different days of the week.
To do this, we first need to name our new report. Something original like “Time of Day – Day Of Week Performance Report” will do. This helps you remember what you were looking at if you come back to this later.
Next up, we need to select our metric groups. Our first selection should be users, our second, revenue per user.
Then, in our “Dimension Drilldowns”, we need to select firstly “Day of week name” and then “hour”.
In summary, it should look a little something like the below:
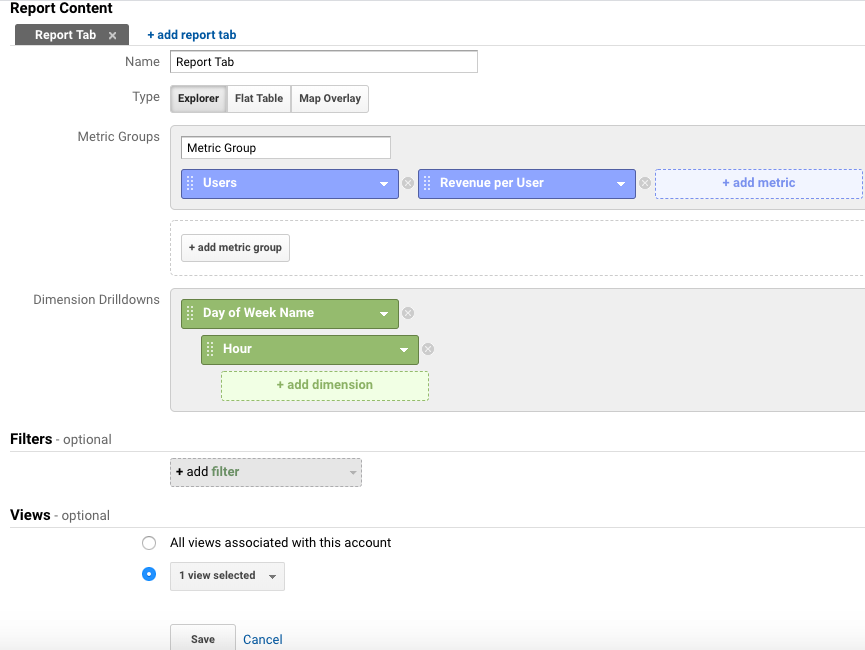
We are also given the option to add a filter to the report. This will allow us to filter our report to see specific parts of our traffic, for example, Google Ads. For this exercise, we’ll leave this blank.
Click save and it will generate our report. The report will look a little something like the below:
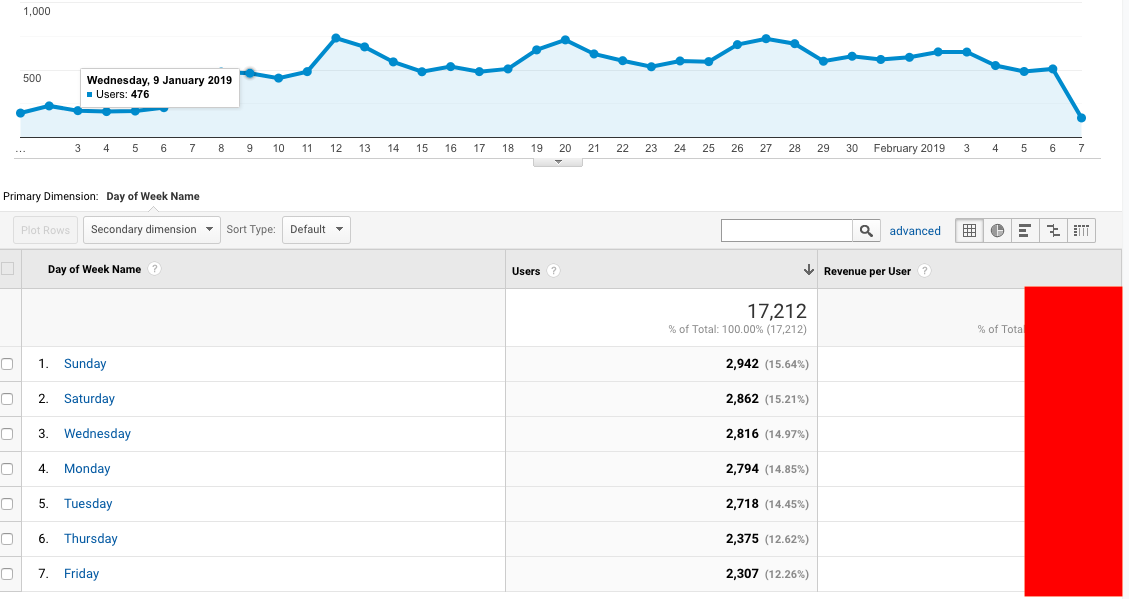
At this stage, we have enough information to begin building an interesting view of our businesses online performance. You’ll currently be able to see The “average revenue per user” on each day of the week.
Does anything stand out here? Do you see 1 particular day of the week that out-performs the rest? Is the weekend really bad?
Put into perspective, this report helps us see something that physical shop owners can see very easily. If there are tons of people in your shop every day, but you’re not making any money, there’s something wrong.
From here, we can then look at this in further detail. If you click one of the days of the week, you’re then able to see a report similar to below:
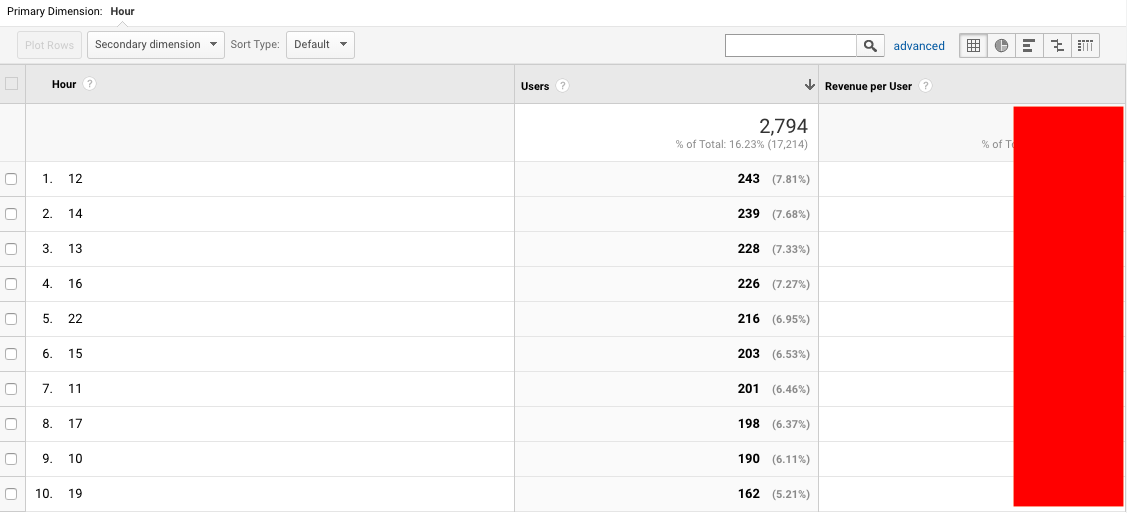
This shows you the revenue per user on each hour. Please do bear in mind, this is all dependant on the date range that you set in the top right corner of Google Analytics.
How does this help us?
Well – I use this report to determine which hours of the day and which days of the week are most effective to be running Google Ads. This is extremely helpful because if I notice anything significant; for example that only 1 person has made a purchase on a Sunday in the last 6 months, out of a total 2000 visitors on a Sunday, I can use that information to determine that Sunday simply isn’t a good day to run ads. The long term value of this is huge!
At number 2 in our Google Analytics For Beginners guide we have cost per conversion. This one is pretty self-explanatory, yet so important to help you determine the effectiveness of your online campaigns.
This metric is particularly useful for businesses that generate leads online, but make their sale offline. It’s still just as important to understand the effectiveness of your campaigns so that you can set KPIs and improve over time.
A great example of this is if you use Google ads to generate leads such as phone calls and contact/quote form fills. Let’s use a working example:
The best way to work out your cost per conversion is to use Google analytics (we could use Google Ads, but it’s simply easier to see in Google Analytics).
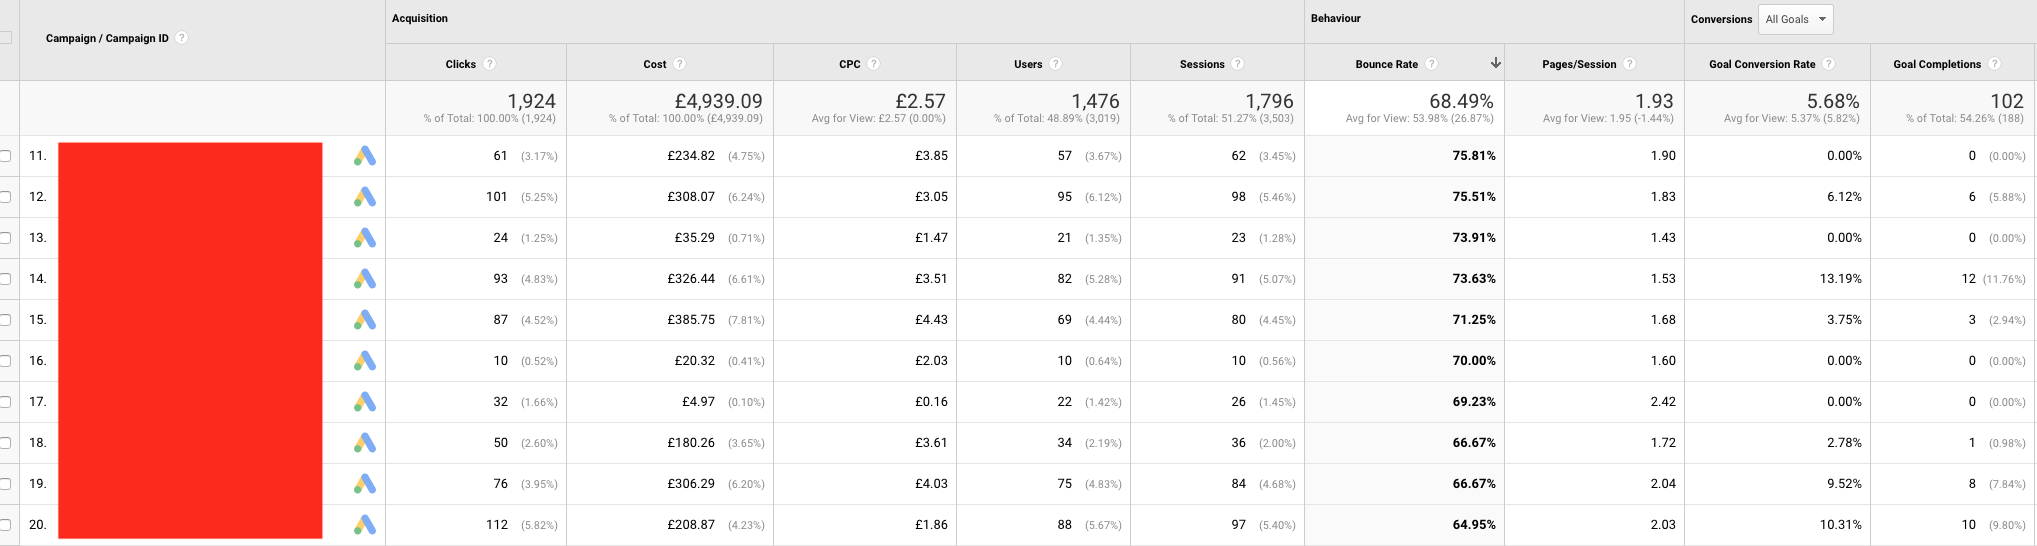
Head to the Google Ads campaigns section of Google Analytics (in the same manner as number 5 on our list). From here you can see the overall cost of ads for your chosen time period, as well as a breakdown by campaign of the results. You’ll also be able to see the number of “goal completions” and the campaign that was responsible for them.
To work out your cost per conversion simply do cost/goal completions. So in this example, our whole account cost per conversion is £4,939.09/102 = £48.42.
How do we use this information?
As a business there are 2 key things we can do here:
a. We can see how much our leads cost. If we then do a calculation to work out how much each lead was worth in £ (revenue of business/leads) then we can see if we’re making money per lead, or if it’s costing too much per lead.
b. We can see how our campaigns are progressing. If you select a different time period (e.g. the same month in the previous year) and do the same calculations, you’ll be able to determine your YoY and MoM progress.
If you offer a range of services then you can do the same calculation per campaign or ad group.
Give it a go. Find out just how profitable your campaigns are and let me know if you’d like some help improving it!
Finally, in at number 1, we have Cost vs Revenue. For any business, this is the be-all and end-all. Are you making more money than you’re spending? If not, I’d certainly recommend reassessing your marketing.
Although this technique of measuring results works best for e-commerce websites, it can be used in some manner for almost any business
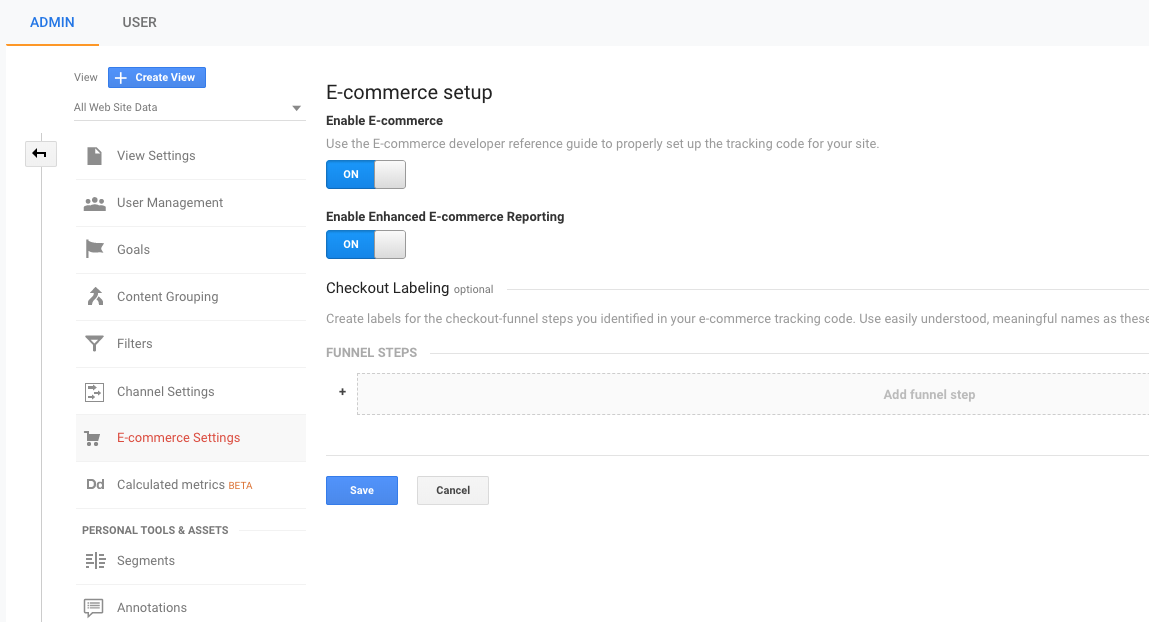
E-commerce websites offer the functionality to track the revenue that you make through your website directly in Google Analytics. You can do this through the use of a data layer and Google Analytics’ built-in e-commerce tracking function.
More information on how to set this up, along with the enhanced functionality, can be found here in this awesome E-commerce tracking guide by Optimize Smart.
Businesses that do not track revenue through their website, and instead track leads, are still able to make use of the E-commerce functionality of Google Analytics. For example Google Analytics’ Data Import allows you to pass data from your CRM, to import the revenue that your business has generated. More information on this can be found here in Google’s Data import documentation.
So how do we extract this data?
Head to the Google Ads section of Google Analytics once again but this time, under the “conversions” section of the report, select the eCommerce option rather than your goals. Like below:
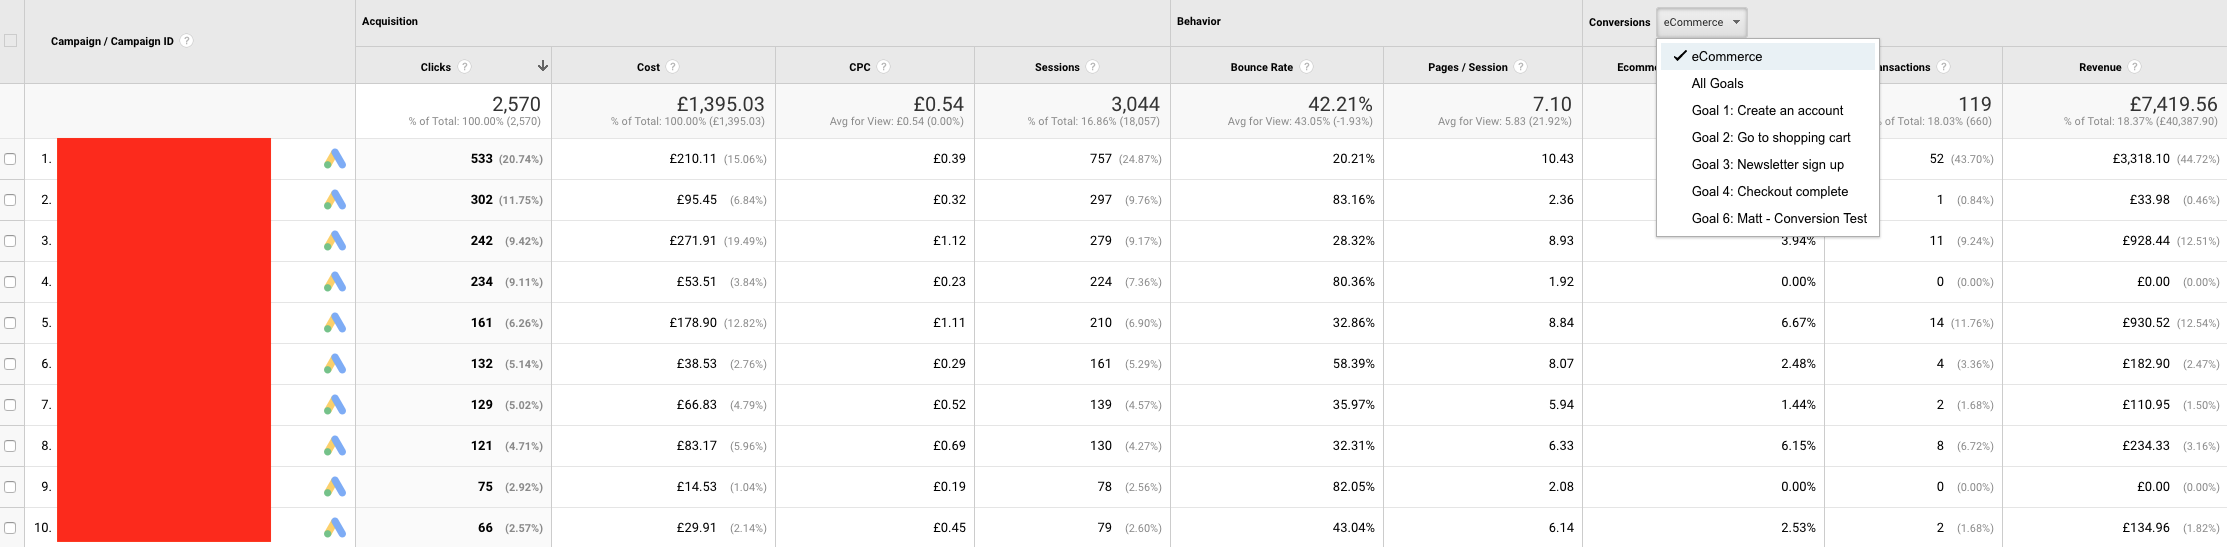
From here, you’ll be able to see the cost and the revenue of all of your campaigns (assuming you’ve got eCommerce tracking set up). Using this information you’re then able to calculate the ROI of your Google Ads campaigns. To do so, simply divide your revenue by your cost. In our example above this would be:
Revenue/Cost = £7,419.56/£1,395.03 = 5.32x (to 2 decimal places)
Now, this is obviously only the ROI directly from your Google Ads cost. The likelihood is, especially if you run an E-commerce business, that you have costs associated with each product that you sell. Generally, these can include:
Cost of the product itself
Cost of delivery
Other overheads of the business
These all add to the calculation, and will therefore affect your bottom line. Let’s find out if we’re still making a profit in our example:
Cost of Google Ads: £1,395.03
Cost of products = 119 x £12 = £1,428
Delivery cost = 119 x £2.99 = £355.81
Other overheads = staff wages + storage rent = £1,238 + £580 = £1,818
Therefore, our total calculation is as follows:
£7,419.56 / £1,395.03 + £1,428 + £355.81 + £1,818 = £7,419.56 / £4,996.84 = 1.48x
Bingo! Even after all of our costs, we’ve made a profit!
Being able to keep an eye on this makes it very simple to keep track of your Google Ads (and your current agency, if you have one), and check that you’re getting the results your business needs.
Google Analytics For Beginners: You made it!
Keeping track of these 5 different elements of Google Analytics will ensure that the performance of your Google Ads is exactly where you need it to be. Stay tuned for the next instalment of Google Analytics For Beginners!
Google Ads not performing? Why not get in touch – let’s discuss how we can maximise your Google Ads ROI and bring your marketing from negative, to positive.